How to Create Crystal Like SSRS Report with Report Builder
Introduction
Microsoft Report Builder is a standalone SSRS report designer. With this tool you can design reports and do not need use the embedded report designer in Visual Studio. This tool is supposed to do what Crystal Reports Writer to do for rpt files. Crystal Reports is known for printing, and many customers get used to the Crystal Reports styles. Report Builder seems more for Web Reporting, to show reports on web browser. When customers use Report Builder to create rdl reports, they find it is all Microsoft reporting styles. They do not know how to create Crystal like Reports with Report Builder.
In this article we will show step by step on how to create Crystal like SSRS report with Report Builder. Before we start, we must say that the easiest way to have Crystal like SSRS reports is to create a Crystal Reports with Crystal Report Writer and then convert the report with our Advanced Automatic conversion. Most reports can be converted within a second and the conversion quality is very high. Usually the converted rdl is ready to run with no or little manual fixing. Here we do not show the automatic approach, and we will show how to create Crystal like SSRS report manually.
New! You may try our SSRS Ad Hoc Web Reporting. A well formatted SSRS can be created by a few button clicks. It is the easiest way to create and view SSRS Reports.
What will be Covered in the Report?
In this report, we will show the following.
- Add Page Header, execute date, time
- Add Page Footer, logo, Page N of M, RichText, Hyperlink
- Free format report, Grouping, Summary, Percentage Summary
- Conditionally hide those groups not needed in the report based on summary values.
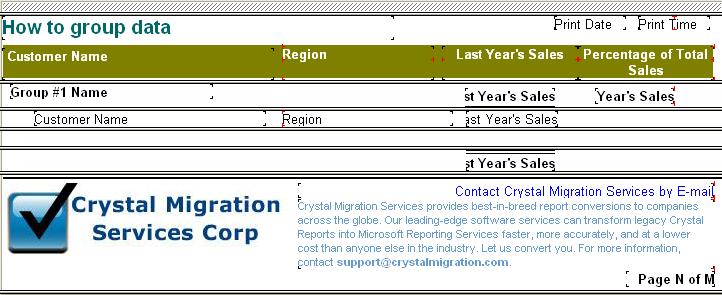
The objective is to create a SSRS report as the following Crystal Report. Here is the Crystal Report design view.
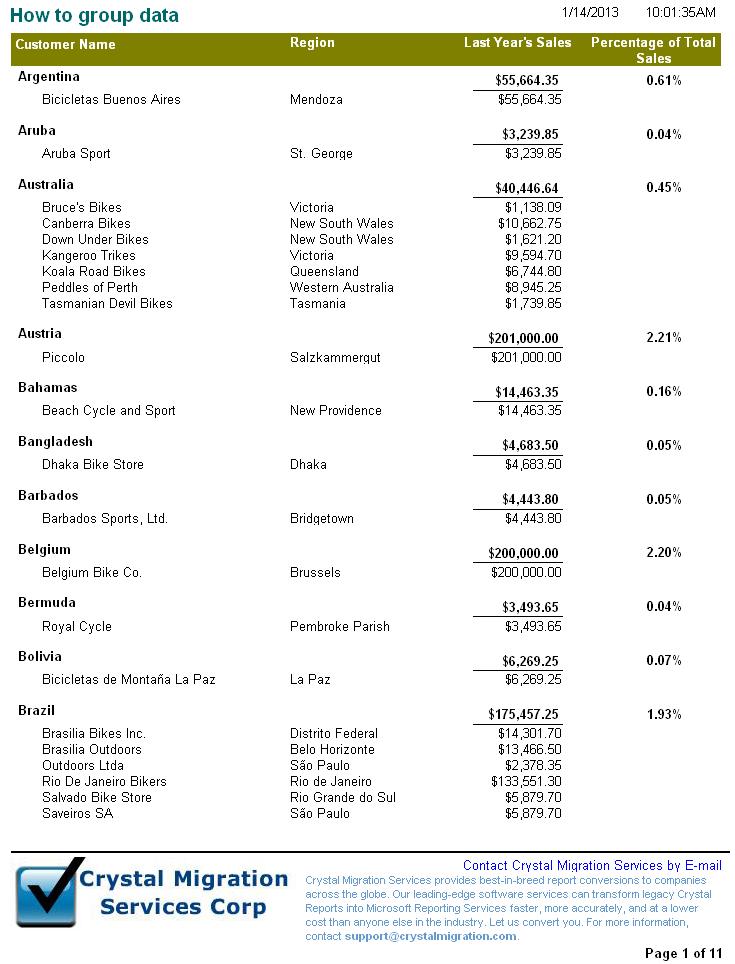
Here is the Crystal Report in preview.
Add Page Header
First, launch Report Builder 2.0. If you do not have Report Builder 2.0, it can be free downloaded from Microsoft site.
![]()
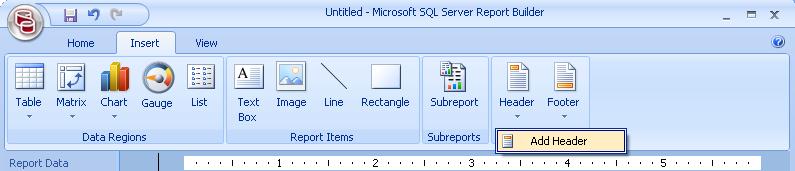
Next, remove all the default objects and the report design area will become blank. Then Add Page Header.
Increase the report width. Now we can the following objects to the report header.
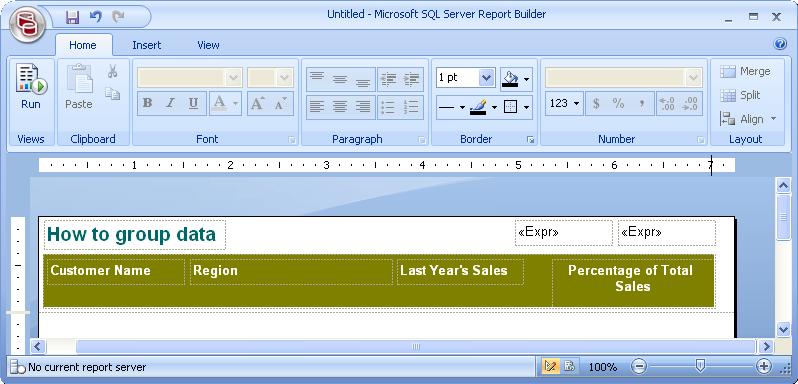
- Text Object to the page header, How to group data, Arial font, bold, size 14, color "Teal".
- Add text object for execute date, the definition is =Format(Globals.ExecutionTime, "M/d/yyyy")
- Add text for excecute time, the definition is =Format(Globals.ExecutionTime, "h:m:s tt")
- Add a rectangle object, no border, and the fill color is "olive"
- Add four text objects on the top of the rectangle object, these four text objects are "Customer", "Region", "Last Year's Sales", and "Percentage of Total Sales", style, bold, color, white.
Here is what the report will look like.
The reason why we use the page header instead of the Tablix or Table header is that the Tablix or Table header is buggy, and it may not repeat itself in each page even if you set it to repeat on each page..
Add Page Footer
Now we are going to add the page footer. There are five objects, a line, an image and three text objects.
- Add the line object to Page Footer
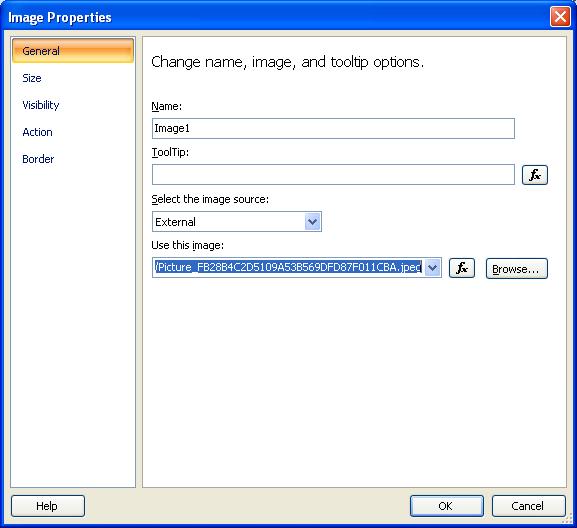
- Insert an image to page footer, choose external, and image source from "http://www.crystalmigrater.com/ReportImages/Picture_FB28B4C2D5109A53B569DFD87F011CBA.jpeg"
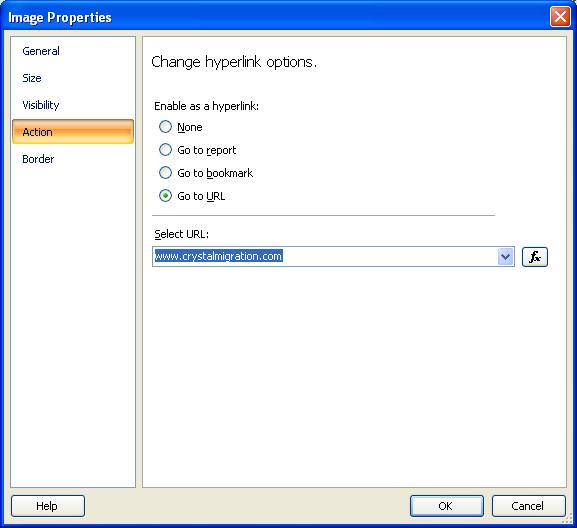
- Add hyperlink "http://www.crystalmigrater.com" to the image.
- Add a text object "Contact Crystal Migration Services by E-mail". The hyperlink for this is "mailto:sales@crystalmigraiton.com", you may add this email hyperlink the same as the last step.
- Add a text object "Crystal Migration Services provides best-in-breed report conversions to companies across the globe. Our leading-edge software services can transform legacy Crystal Reports into Microsoft Reporting Services faster, more accurately, and at a lower cost than anyone else in the industry. Let us convert you. For more information, contact support@crystalmigrater.com.", and highlight the email part to bold.
- Add a text object for "Page N of M", the definition is "="Page " & Globals.PageNumber & " of " & Globals.TotalPages", make the font bold.
Here is how the report looks like with both page header and page footer.
The Key Part - Report Body
To make page header and page foot look like Crystal Reports page header and footer is not a big deal. The key for Crystal Report like SSRS reporting is "Report Body". The default style from Report Builder is quite different from Crystal Reports. Let us show how to create a Crystal Report like report body.
- Insert a table object(Not use the Wizard). If you try to create a crosstab like report, you need choose Tablix instead.
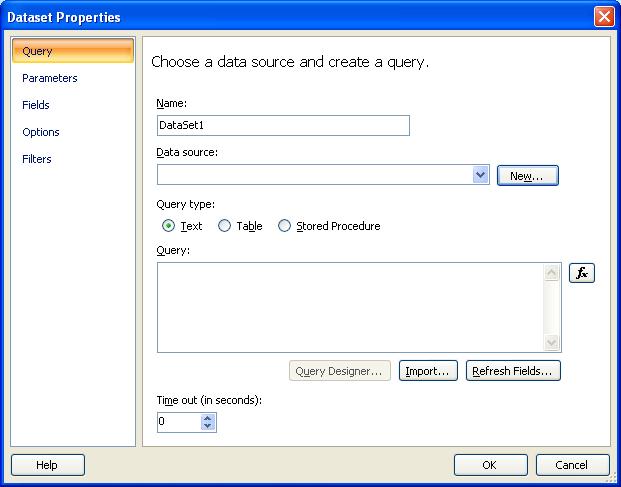
- The dataset properties dialog shows up. Then click on the "New" Button.
- The data source properties window shows up. Choose the "Use a connection embedded in my report radio button, and select the "ODBC" connection type. Click the "Build..." button.
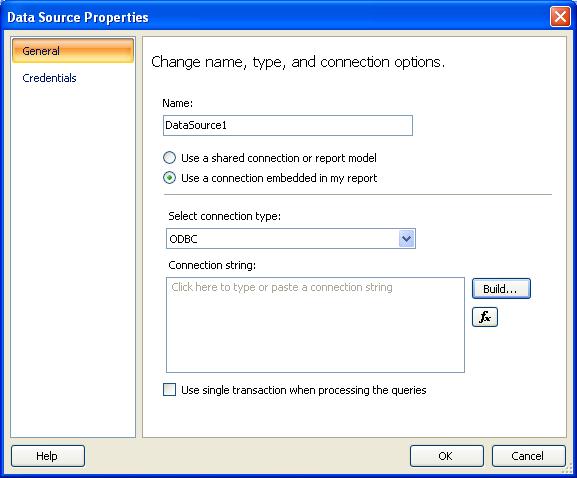
- The connection properties comes up. Choose "Xtreme Sample Dataset 2005" as the data source name. If you do not have this data source name the list box, you need create a DSN of ODBC connection based on "Xtreme Sample Database.mdb". This access DB can be downloaded from web.
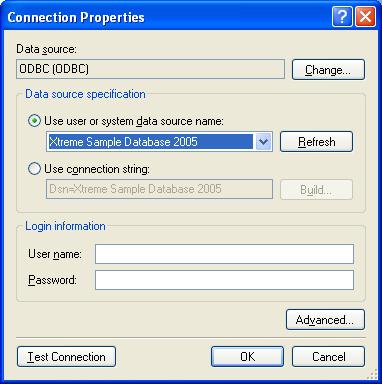
- Click OK in the connection Properties dialog, and then click OK button in the Datasource properties dialog.
- Copy the SQL code to the query window. "SELECT Customer.Country, Customer.[Customer Name], Customer.[Last Year's Sales], Customer.Region FROM Customer Customer ORDER BY Customer.Country, Customer.[Customer Name]"
- The dataset properties dialog will look like this. Then click on the "OK" button. Now the dataset is ready.

- Now the report will look like this.
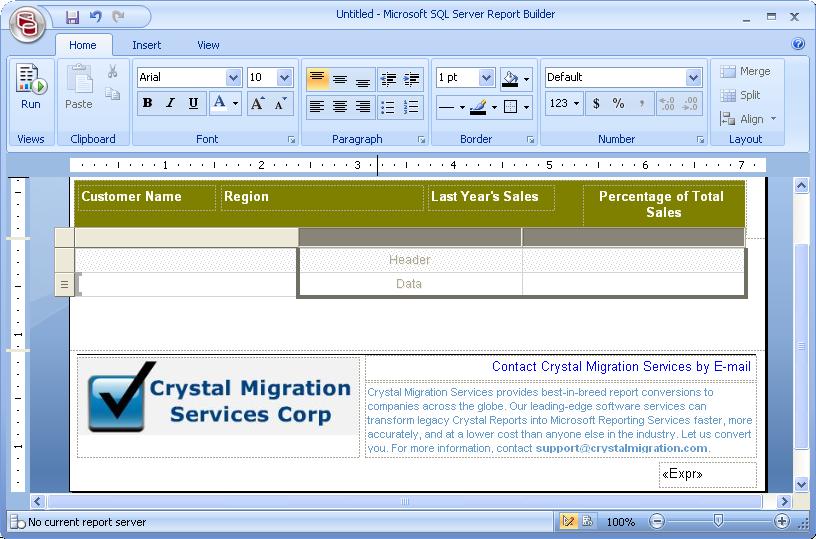
- Remove the right two columns, and then remove the first row, the "Header", not the "Data" row.
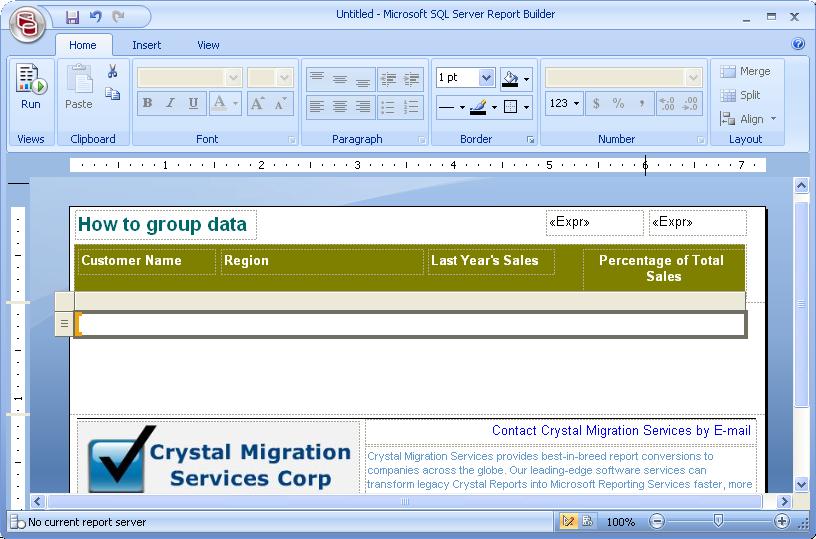
- Now there is only one row and one column left for the table. Add a Rectangle to the row. The Rectangle will become a container for other objects. In SSRS, if you want to add more than one objects to a grid cell, you need insert a rectangle as the container for other objects, otherwise a grid cell can only have one report object. Now the report will looks as follow.
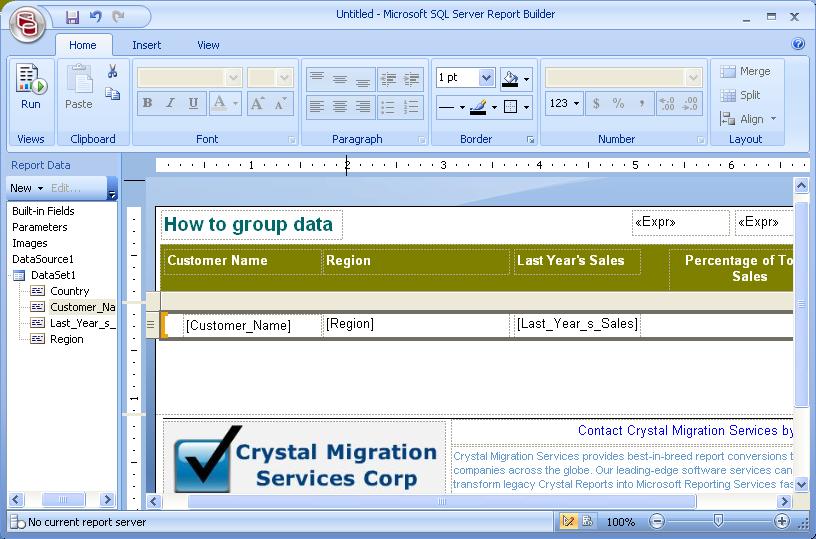
- Now we can drag and drop three fields, "Customer Name", "Region" and "Last Years Sales" one by one from dataset to the Data in the table. Then align the three field properly. Now the report will look like this.
- Next, let us insert a "parent group to the report.
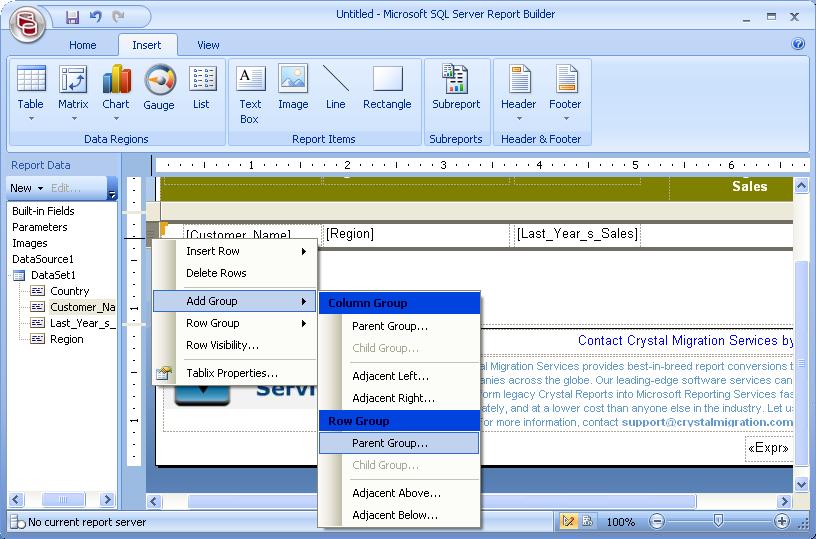
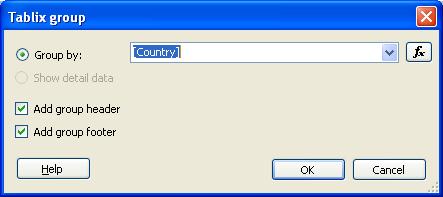
- The "Tablix Group" dialog appear. Choose group by "Country", and make sure to select the "Add Group Header" and "Add group footer". Click OK button to insert the parent group.
- Now we have the table with a group, but this is still not what we want, and we still need some extra steps. Here is the screenshot.
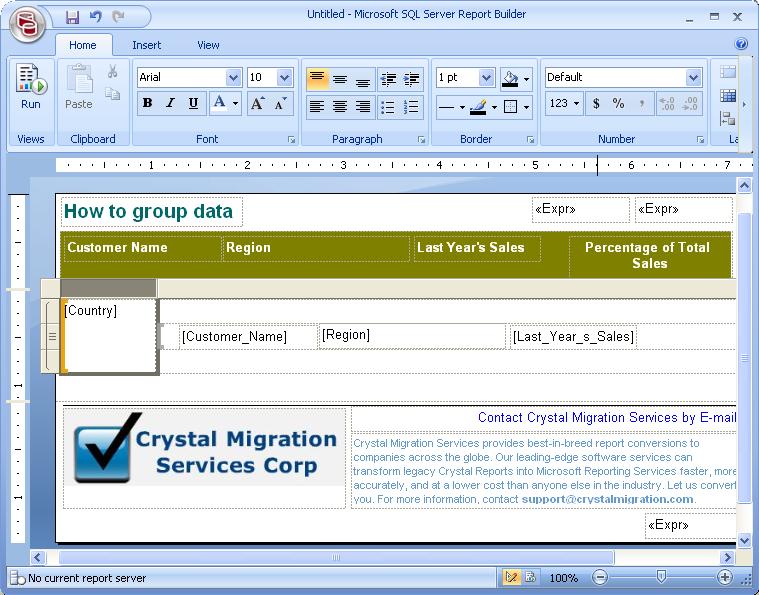
- Remove the first column, the one with "[Country]", the adjust the table, and report width. After that, insert a Rectangle to the first row and third row respectively.
- Insert a text object to the first row, the definition is "=Fields!Country.Value", make it bold. This is the group name.
- Insert a text object to the first row, the definition is "=Sum (Fields!Last_Year_s_Sales.Value)". This is the group summary. Make it bold, right aligned, and check the bottom border.
- Insert a text object for percentage summary to the first row. The definition is "=Sum (Fields!Last_Year_s_Sales.Value)/Sum (Fields!Last_Year_s_Sales.Value, "DataSet1")". Make the text object bold, and check the percentage for the format.
- Add a text object under the table. It does not belong to the table. It will be the grand total for last years sales. The definition is "=Sum (Fields!Last_Year_s_Sales.Value, "DataSet1")". Make this object bold, and check the top border line to show up. The format is currency, using default.
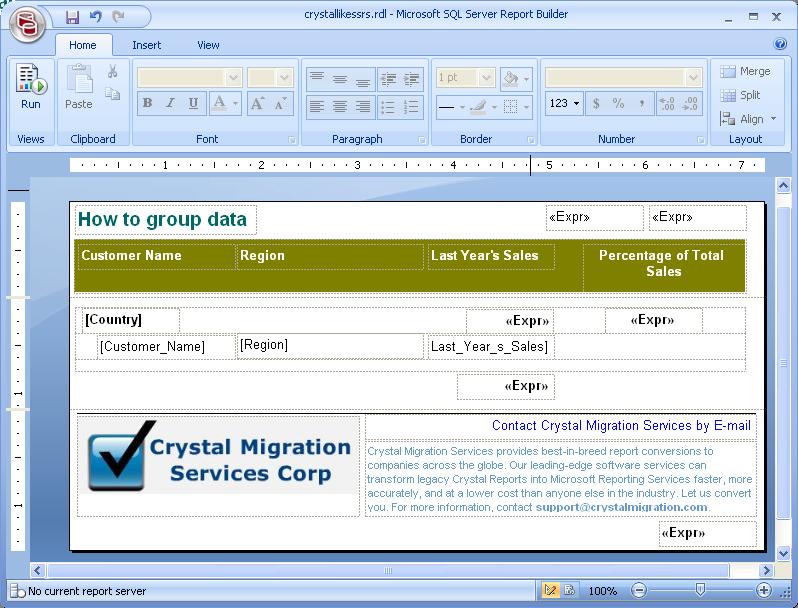
- Save the report as "crystallikessrs.rdl". Now the report is done.
Here is what the finished rdl looks like in the report builder.
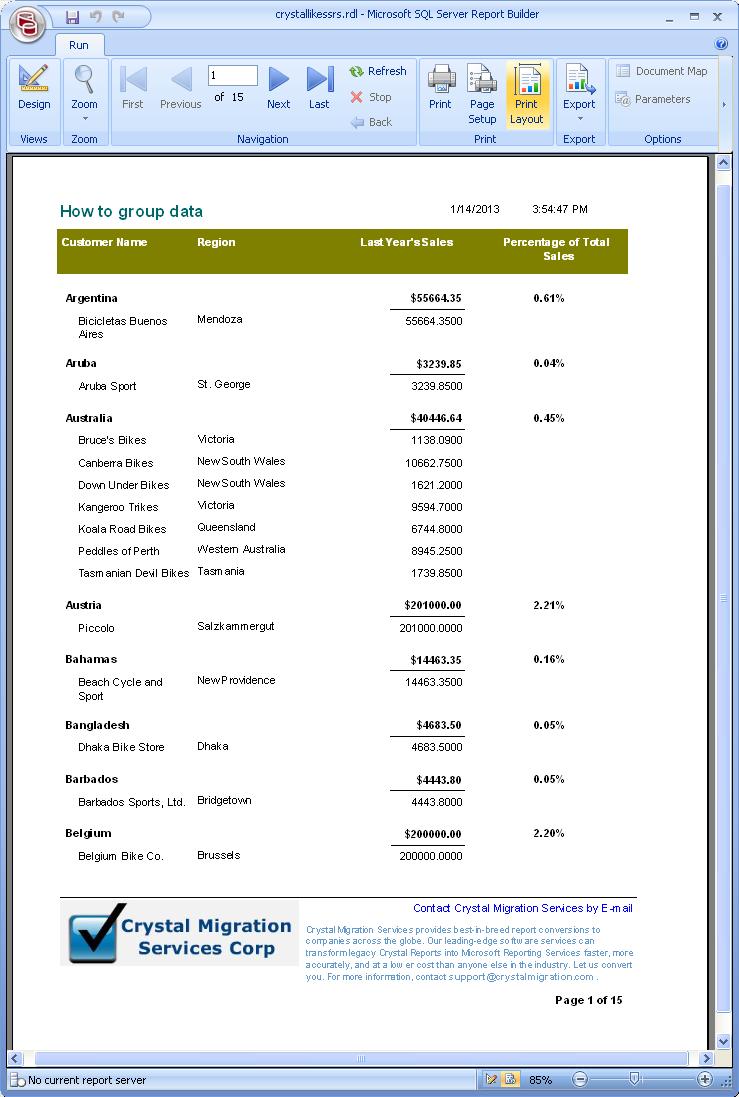
When this report is run in Report Builder, you find there are some blank pages. How to fix it? This is because of the default top, bottom, left and right margins are too big. It is 1 inch. Then the report with plus the report with is great than the page width. The same is true for page height. That is why blank page shows up. After we change all these margins to 0.5 inch, the blank pages are all gone. Here is the report previewed in Report Builder.
Conclusion
Yes, it is possible to create a Crystal like SSRS report with Report Builder. SSRS is powerful enough and can so almost anything Crystal Reports can do. It is true to manually create such a report takes some extra efforts. If you have quite a few Crystal Reports and would like to do the same with SSRS, to do all these reports again manually is very time-consuming. The good news is that, you can use our service to convert the legacy Crystal Reports to SSRS automatically and fixing the outstanding issues. This can save your money and time tremendously.
You can download the original Crystal Reports, the automatic converted version, and the one we manually created from scratch. If you take a look at the both the manual created one, and the automatically converted one, you will find the automatically converted one looks more close to the original one because in the automatic conversion, the position, sizing and formatting can all be precisely converted. For this report, the advanced automatic conversion result is already a full conversion, and no manual tweaking is needed.
You can download all files here.